
Celebrating India's 80th Independence Day 🇮🇳
Special Independence Festival Offer · Flat 75% OFF All Schedulytics Tools
 ⭐ 75% OFF SPECIAL
Ends 20 September 2026
⭐ 75% OFF SPECIAL
Ends 20 September 2026
⭐ 75% OFF SPECIAL
Ends 20 September 2026
⭐ 75% OFF SPECIAL
Ends 20 September 2026
Progress Schedulytics is the standalone Primavera P6 XML viewer and reporting suite. It opens and converts P6 XML exports into complete reporting packs: a 22-sheet Excel analytics workbook, an interactive HTML dashboard, a PowerPoint executive deck, and an automated Delay Report in Word & PDF format — 100% offline without requiring Oracle Primavera P6.
The app is a free download with a 30-day evaluation trial. A single licence key unlocks clean unwatermarked reports across 2 devices (Windows PC and Android phone).
Planning engineers, project controls staff, PMO leads, and project managers who report progress and risk on EPC, construction, water, or oil & gas projects — without rebuilding the same slides and spreadsheets every cycle.
Generates executive summary, S-Curves, WBS breakdown, SPI/CPI trends, look-aheads, and automated delay distribution matrices.
Pre-built templates for Engineering Deliverables (MDR & weight-vs-progress), RFIs, Material Procurement, and GIS Linear Progress Mapping.
Two-way cross-filtering between high-level KPI cards, milestones, and hierarchical WBS Gantt tree explorer.
Management-ready slide deck covering KPIs, WBS performance, Plan vs. Actual variance, and S-curves in seconds.
Formatted delay narrative and root-cause analysis generated automatically by comparing period updates.
1 perpetual license activates 1 Windows PC + 1 Android smartphone on Google Play for jobsite mobility.
Zero cloud uploads. All parsing and calculations run in local machine RAM, preserving strict NDA compliance.
Complete star-schema CSV tables, ready Power Query M code (queries.pq), and copy-paste DAX measures (measures.dax).
Comparative forecasting overlays contrasting original baseline, approved recovery, and unmitigated delay projections.
Direct impact mapping connecting inspection rejection cycles with downstream driving critical path float leakage.
Detects and resolves illogical logic relationships, redundant progress overlaps, and broken path ties automatically.
Dedicated analytical visuals for site inspection approval rates, NCR turnaround, and testing logs in PPTX reports.
Dashboard, WBS summary, activities, S-curve, critical path, look-ahead, manpower, delay analysis, Monte Carlo, DCMA 14-point, risk register, milestones.
Single self-contained HTML file with WBS navigator, live filters, cross-filtering, EVM cards, S-curve, DCMA, risk, Monte Carlo, Gantt & resource histograms.
Management-ready slide deck covering KPIs, WBS performance, Plan vs. Actual, delay distribution, S-curve, Monte Carlo, DCMA and risk.
Automated Word and PDF format delay narrative report generated by comparing current schedule progress against the previous reporting period.
Visual risk heatmap generated from P6 progress updates. Click any tile to inspect.
| Audit Check | Standard | Civil (Pkg 1) | Structural (Pkg 2) | MEP (Pkg 3) | Commissioning | Project Total |
|---|---|---|---|---|---|---|
| DCMA #01 Missing Logic (No Pred/Succ) | < 5.0% | 1.2% |
3.4% |
8.1% |
0.5% |
3.3% |
| DCMA #02 Leads (Negative Lags) | 0.0% | 0.0% |
0.0% |
0.0% |
0.0% |
0.0% |
| DCMA #03 Excessive Lags (> 5 Days) | < 5.0% | 2.1% |
4.8% |
16.4% |
3.1% |
6.6% |
| DCMA #05 Hard Constraints (Mandatory) | < 5.0% | 0.8% |
1.5% |
7.2% |
1.0% |
2.6% |
| DCMA #06 High Total Float (> 44 Days) | < 5.0% | 3.2% |
4.1% |
12.8% |
2.5% |
5.6% |
| DCMA #08 Out-of-Sequence Progress | 0.0% | 0.0% |
0.4% |
5.2% |
0.0% |
1.4% |
| DCMA #10 Critical Path Continuity | Pass | PASS |
PASS |
BROKEN |
PASS |
FAIL |
Each solid colored cell represents exact compliance risk. Progress Schedulytics audits your .XER update schedule and pinpoints offending activities instantly.
Explore the interactive analytics dashboard, WBS navigator, and schedule risk views.
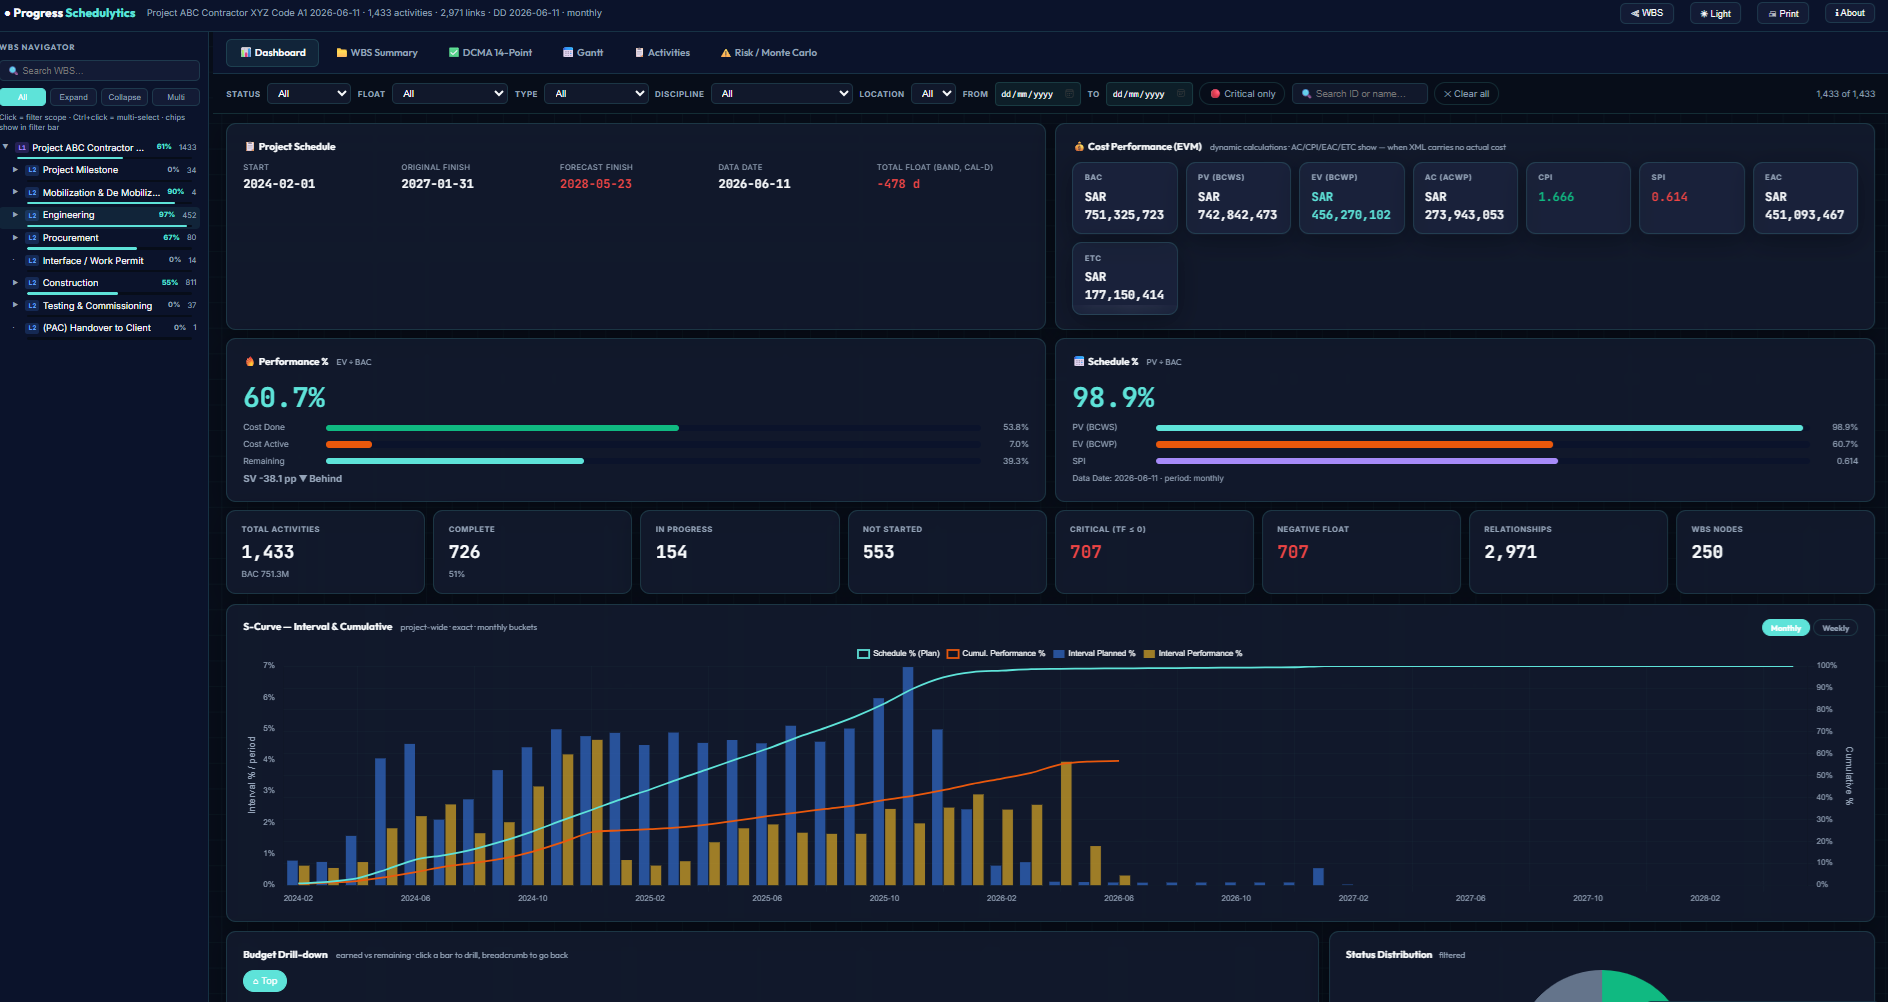
Single self-contained dashboard with EVM KPIs, S-curves, DCMA compliance, and live milestone tracking.
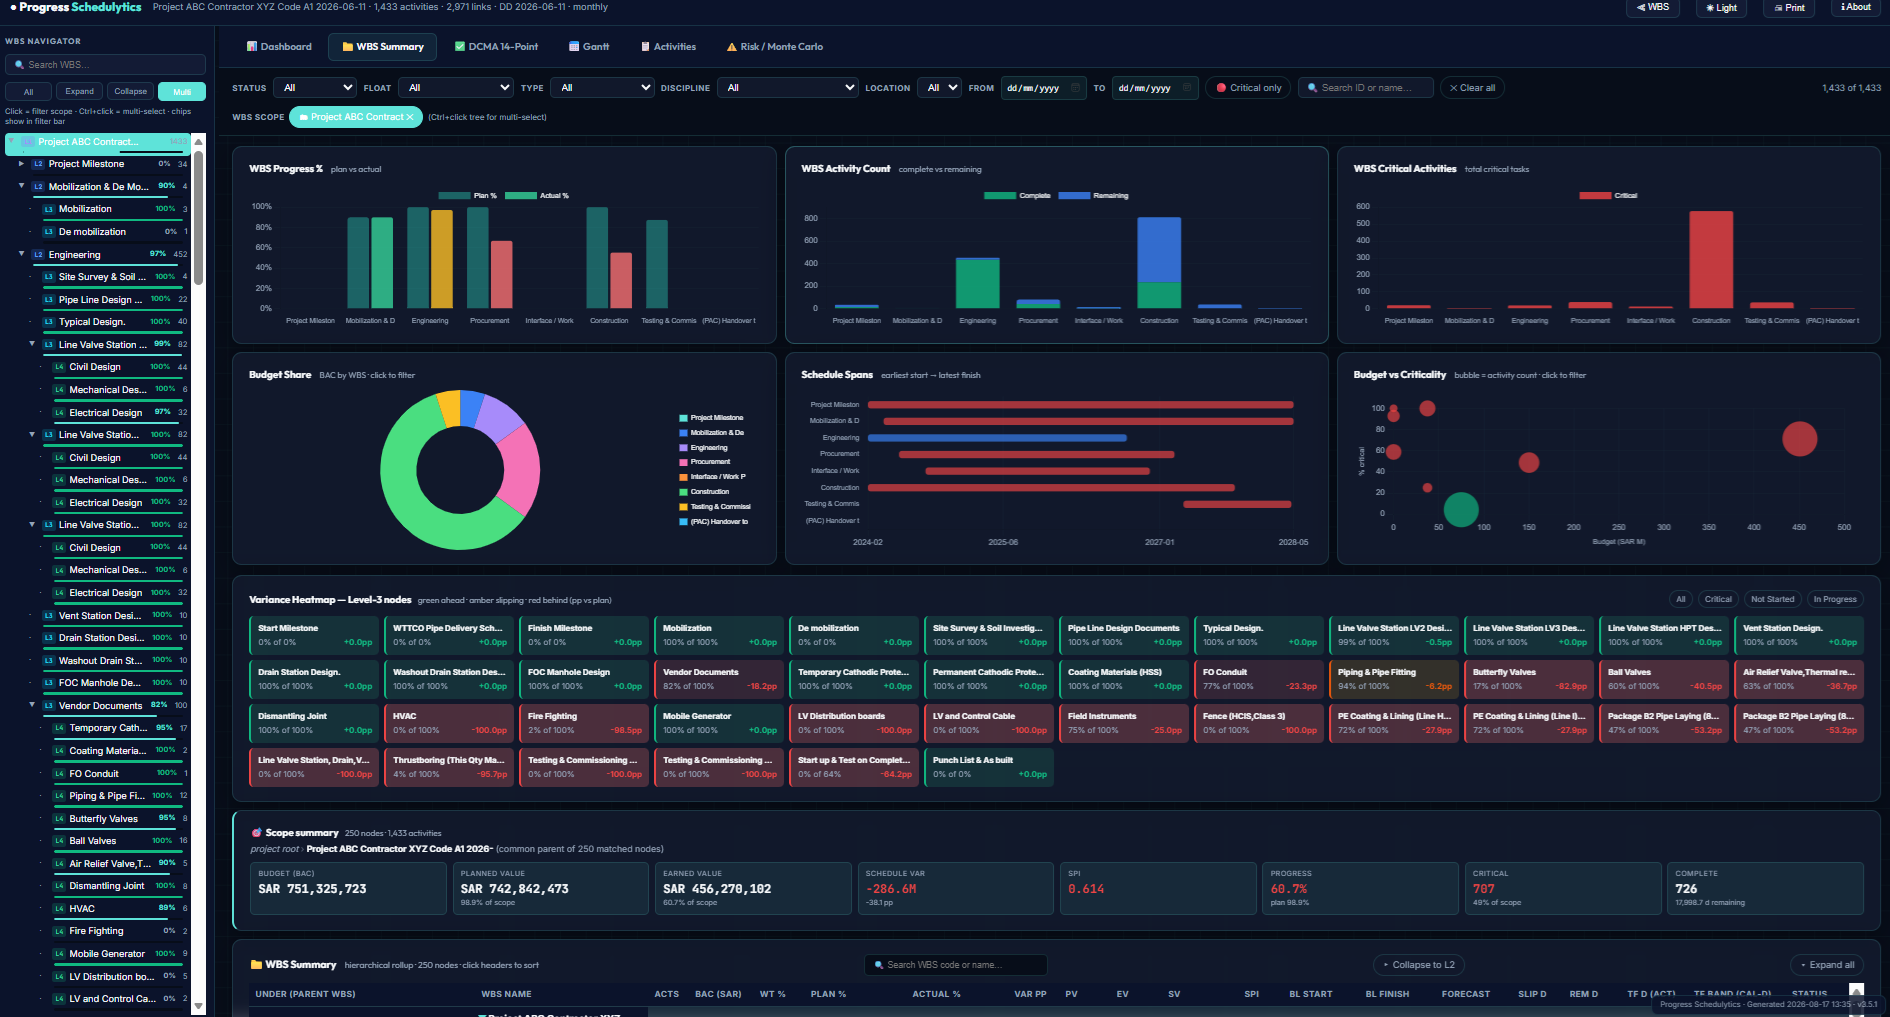
Hierarchical WBS explorer with instant cross-filtering, activity status breakdown, and duration metrics.
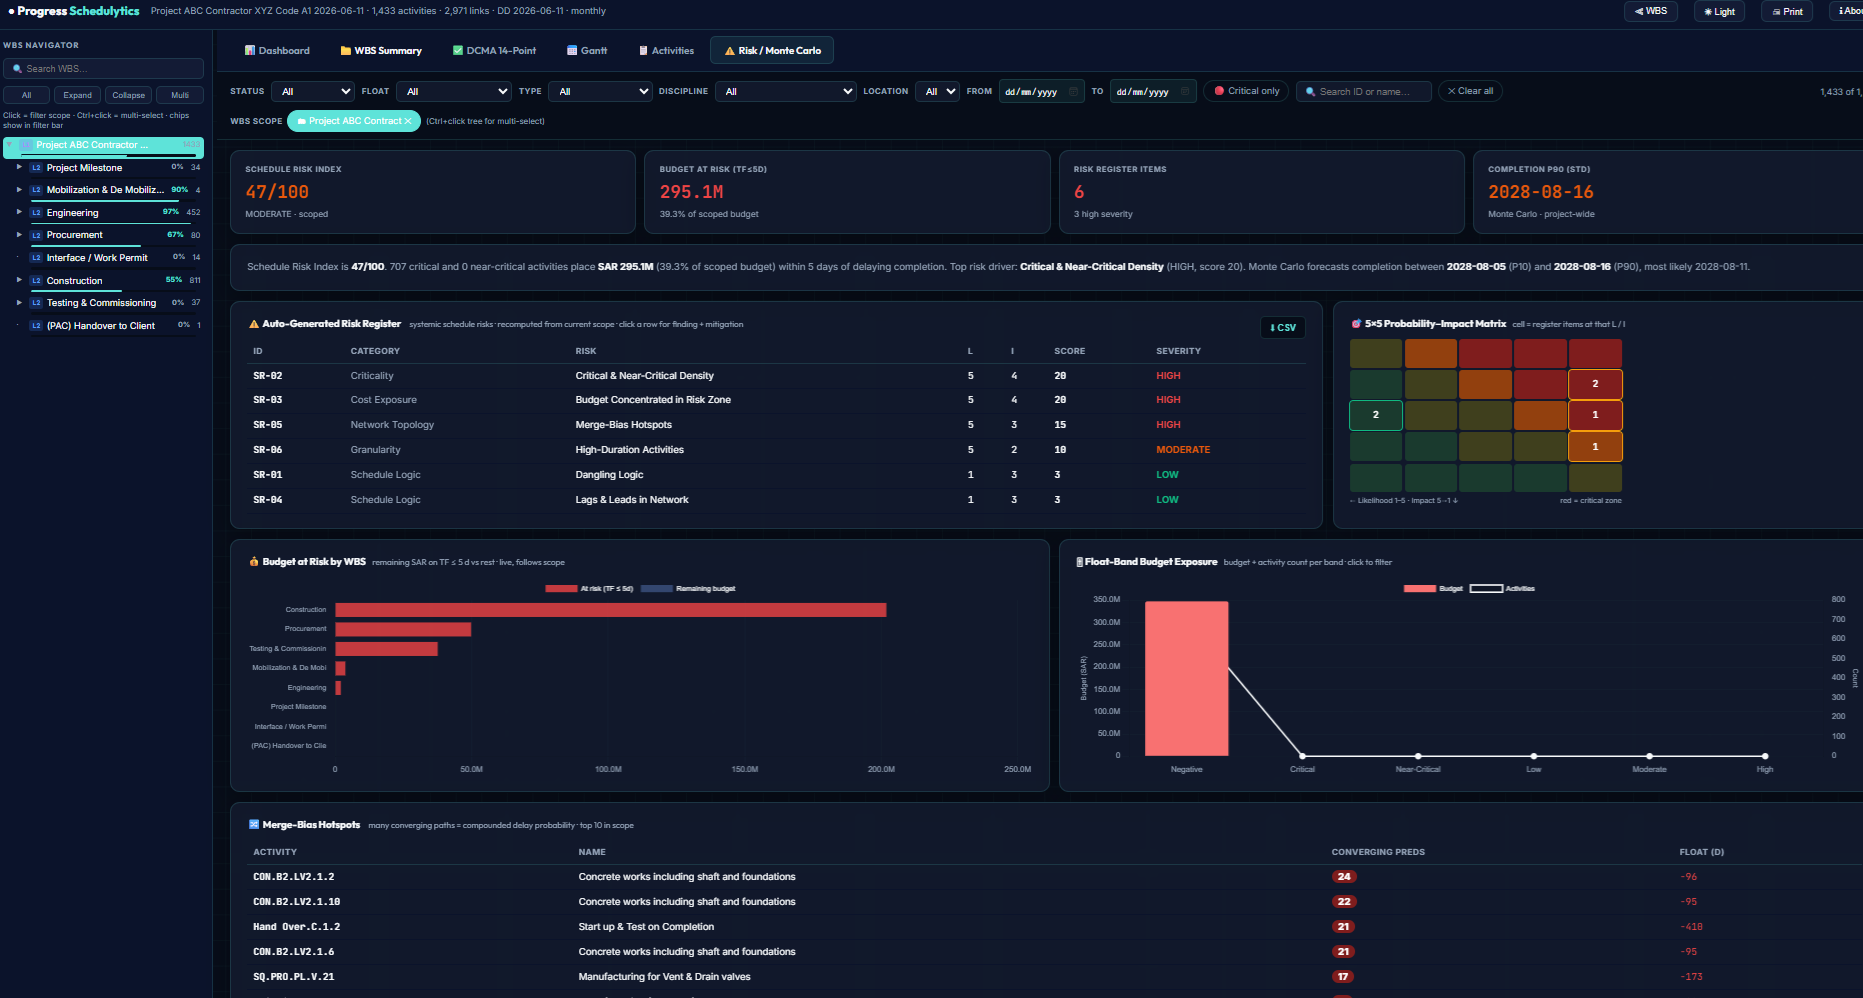
Probabilistic P10/P50/P90 completion date curves, float anomaly detection, and automated 5×5 risk matrix.
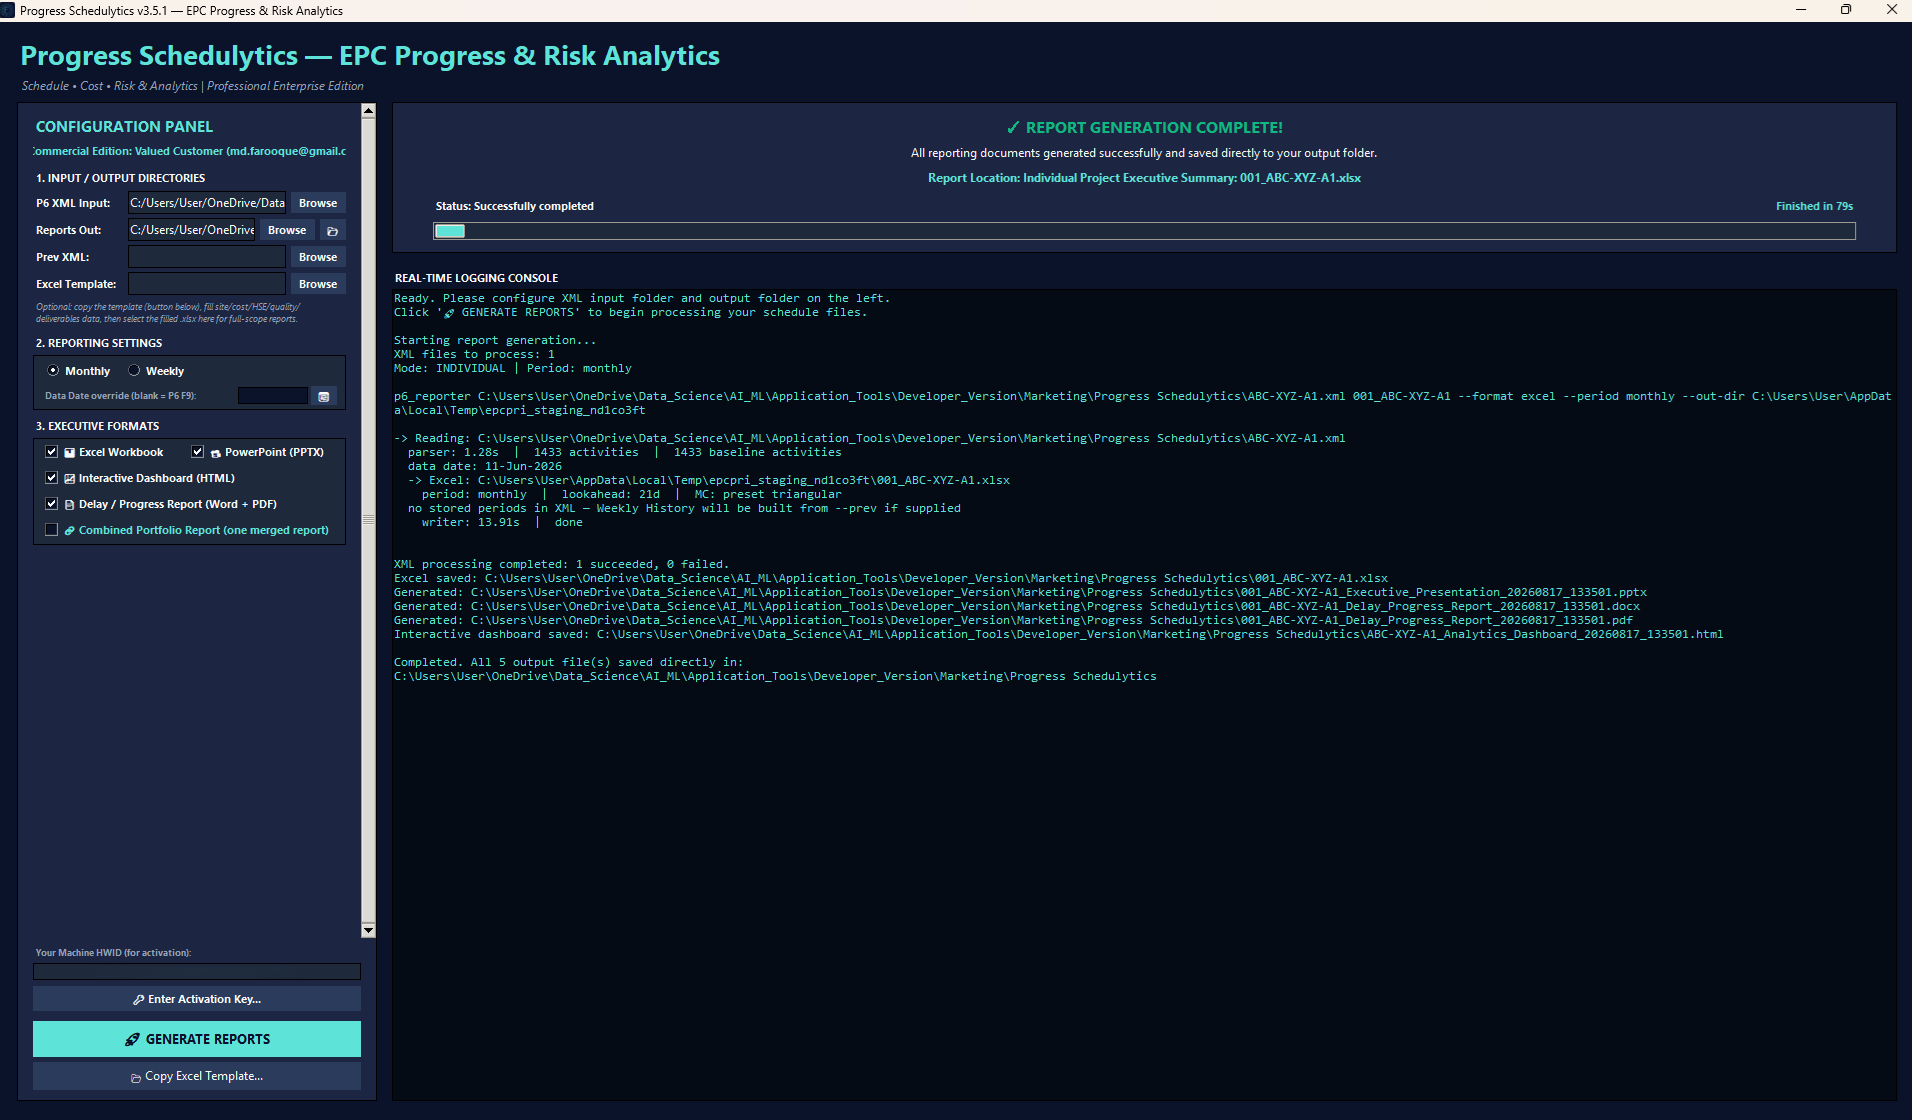
One-click Primavera P6 XML import interface with offline reporting pack generation in seconds.
Perpetual node-locked license activating 2 devices (1 PC + 1 Android Phone). Includes a 30-day free trial. Purchase to unlock clean, unwatermarked reporting outputs — fully offline, no internet required after activation.